Agriculture & Farm Crop Yield, Input Cost & Harvest Ledger
Track field-by-field acreage, seed/fertilizer/chemical input costs per acre, harvest yield in bushels or tons, elevator forward contracts, and net farm profit.
$9.00one-time · free Lite availableBuy ↓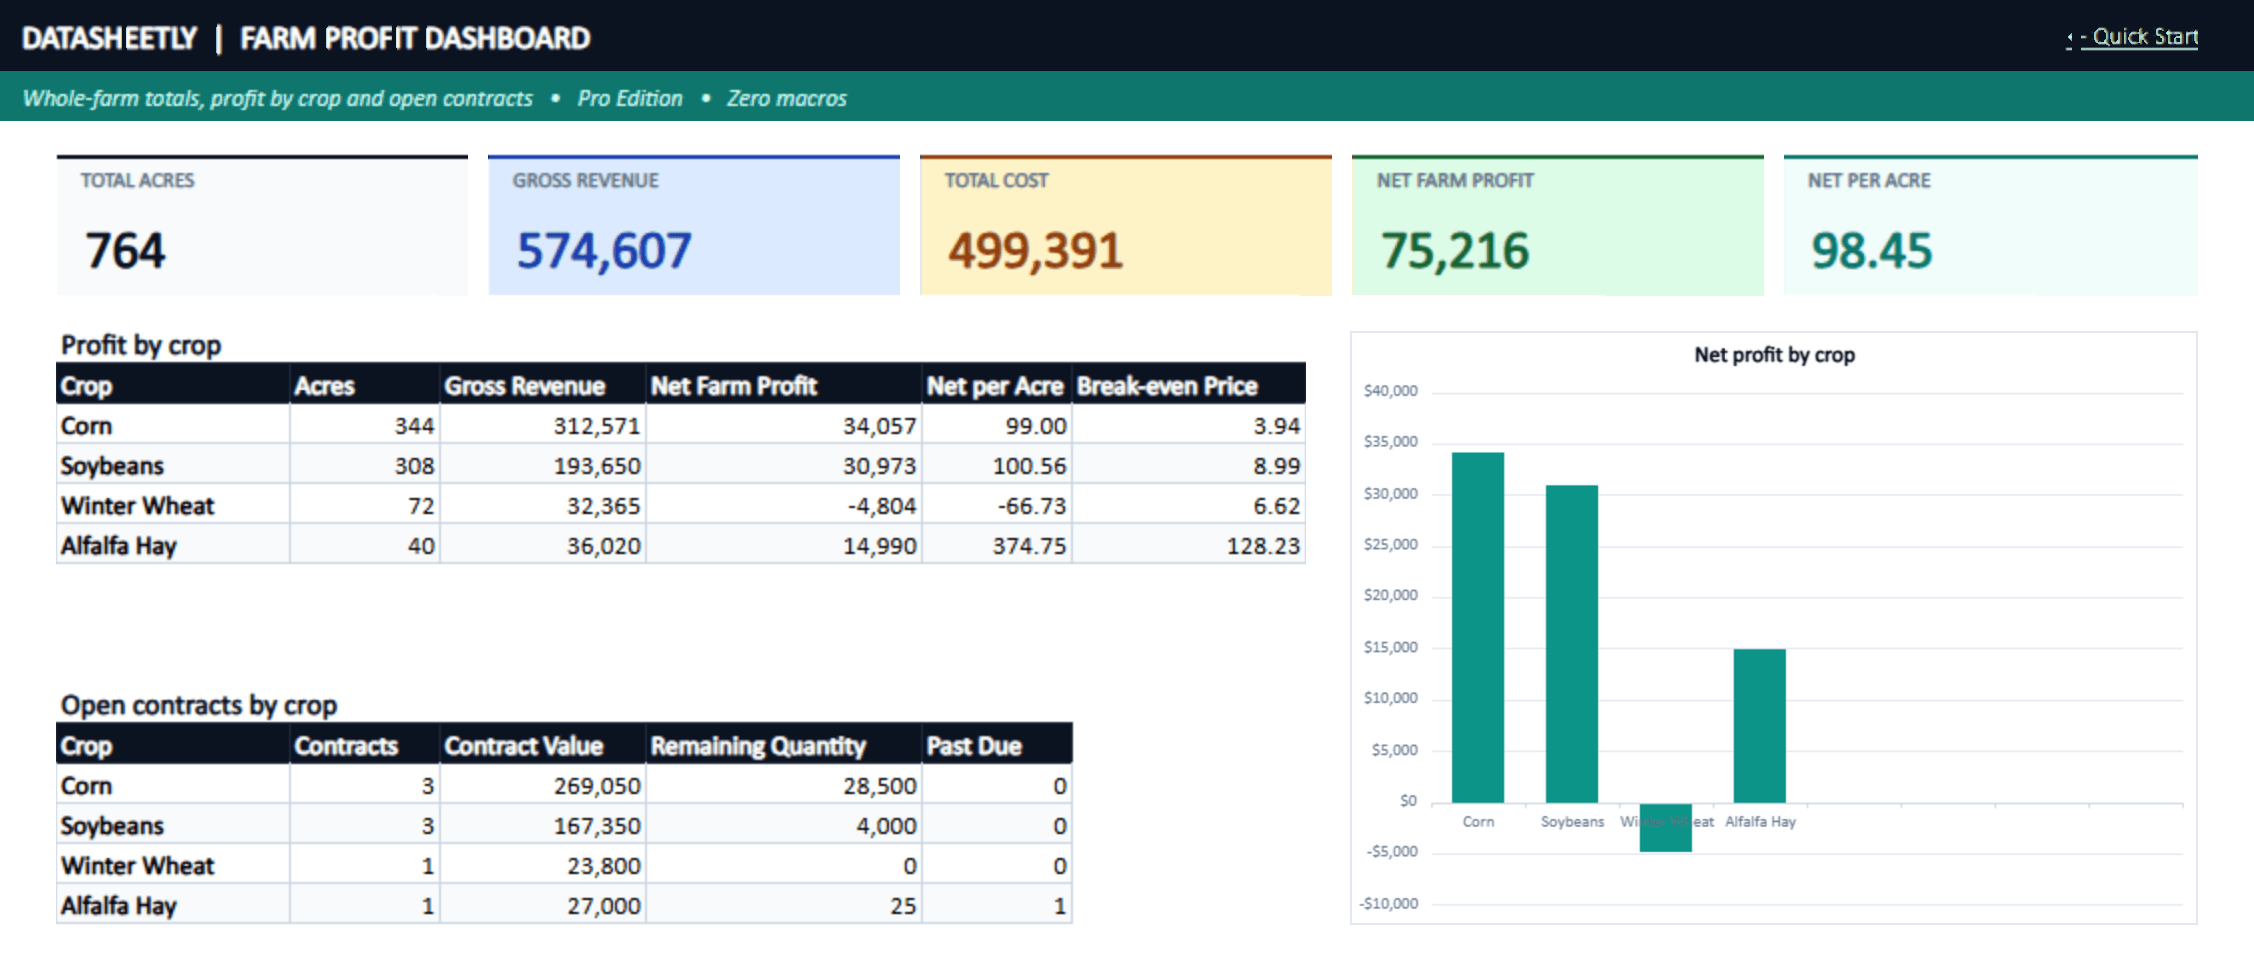
Also included in the Complete Small Business Suite (8 Core Flagship Systems) (8 Excel systems for $35).
What This Workbook Does
Field harvest ledger: seed, fertilizer, chemical, fuel and repairs and custom hire per acre plus land cost and a whole-farm overhead per acre give total cost per acre and per field
Yield per field in bushels or tons: production, actual vs expected yield, cost per unit and the break-even yield you need to cover cost
Elevator forward contracts and spot sales log with contract value, delivered and remaining quantity and an Open, Filled or Past Due status from the report date
Crop marketing position: contracted share of production, unpriced bushels valued at your local cash bid and the blended average price per unit
Net profit per field and per crop after hauling and drying cost, with net per acre and break-even price per unit
Dashboard with total acres, gross revenue, total cost, net farm profit and net per acre, a crop profit table and chart and open contracts by crop
Worksheets Included
7 TabsExcel 2016 or later / Microsoft 365 / Excel for the webNo macrosBlank + sample files
How the Agriculture & Farm Crop Yield, Input Cost & Harvest Ledger is set up
Taken from the sample workbook you download: the settings it uses, what you type in on each sheet and what it works out for you.
Example from the sample file (Crops sheet)
- Crop
- Corn
- Unit
- bu
- Cash Price
- 4.05
- Haul and Dry per Unit
- 0.22
- Haul and Dry Cost
- 15,564.12
- Net Profit
- 34,057.18
- Net per Acre
- 99.00
- Break-even Price
- 3.94
Settings you set once
| Setting | Sample value | What it controls |
|---|---|---|
| Report As-Of Date | 2026-10-31 | Date used for every days-outstanding, due-soon and expiry calculation. Leave blank to use today's date. |
| Overhead per Acre | 85 | Whole-farm overhead spread over every acre: machinery depreciation, crop insurance, interest, utilities |
What you fill in on each sheet
Fields · 11 columns to fill in, 12 calculated
- Field: Field name (unique)
- Crop: Crop planted, from the Lists tab
- Acres: Planted acres
- Land Cost per Acre: Cash rent, or your own land cost per acre
- Seed per Acre: Enter a number.
- Fertilizer per Acre: Enter a number.
- Chemical per Acre: Herbicide, insecticide, fungicide
- Fuel and Repairs per Acre: Enter a number.
- Custom Hire per Acre: Custom application, harvesting or trucking you paid for
- Expected Yield per Acre: Budgeted yield in the crop's unit
- Actual Yield per Acre: Harvested yield in the crop's unit
Calculated for you: Input Cost per Acre, Total Cost per Acre, Total Cost, Production, Yield vs Expected, Cost per Unit, Crop Price, Revenue, Haul and Dry, Net Profit, Net per Acre, Break-even Yield
Contracts · 9 columns to fill in, 4 calculated
- Contract No
- Buyer: Elevator, processor or end user
- Crop: Pick a value from the dropdown.
- Contract Type: Pick a value from the dropdown.
- Contract Date: Enter a date (e.g. 2026-10-05). Ctrl+; inserts today.
- Delivery Month: First day of the delivery month Enter a date (e.g. 2026-10-05). Ctrl+; inserts today.
- Quantity: Bushels or tons contracted
- Price per Unit: Flat cash price per bushel or ton
- Delivered Quantity: Bushels or tons delivered so far
Calculated for you: Contract Value, Remaining Quantity, Delivered Value, Status
Crops · 4 columns to fill in, 14 calculated
- Crop: Pick a value from the dropdown.
- Unit: Pick a value from the dropdown.
- Cash Price: Local cash bid used to value unpriced production
- Haul and Dry per Unit: Trucking, drying and handling cost per bushel or ton
Calculated for you: Planted Acres, Production, Contracted Quantity, Contracted Pct, Unpriced Quantity, Contract Revenue, Unpriced Value, Gross Revenue, Average Price, Field Cost, Haul and Dry Cost, Net Profit, Net per Acre, Break-even Price
Inside the workbook: real formulas
Copied from the sample file (the empty-row check each column has is left out).
=IFERROR(INDEX(tblCrops[Average Price],MATCH([@[Crop]],tblCrops[Crop],0)),0)
=SUMIFS(tblContracts[Quantity],tblContracts[Crop],[@[Crop]])
=[@[Quantity]]*[@[Price per Unit]]
Free Farm Crop Yield & Cost per Acre Spreadsheet
Record each field's acres, input costs and harvested yield, log your elevator contracts, and see cost per bushel and net profit per field, per crop and for the whole farm.
Farm Harvest Data Entry Form and Dashboard in Excel
The workbook uses Excel tables as the data entry form: you type only into the white input columns, and every calculated column fills itself. Entry happens on three tabs:
- Fields: one row per field with crop, acres, land cost, seed, fertilizer, chemical, fuel and repairs, custom hire per acre, and expected and actual yield per acre.
- Contracts: each forward contract or spot cash sale with buyer, crop, delivery month, quantity, price per unit and delivered quantity.
- Crops: the unit (bu or ton), your local cash bid and hauling and drying cost per unit for each crop.
The Dashboard then shows total acres, gross revenue, total cost, net farm profit and net per acre, a profit-by-crop table with break-even price and a chart, and open contracts by crop with remaining quantity and past-due count. Crop and contract type come from drop-down lists, so entries stay consistent.
Worked Example: Yield, Cost per Acre and Cost per Bushel
Five fields from the sample data. Cost per acre is inputs plus land cost plus the $85 whole-farm overhead per acre set on Settings.
| Field | Crop | Acres | Yield / Acre | Total Bushels | Cost / Acre | Cost / Bushel |
|---|---|---|---|---|---|---|
| North 80 | Corn | 78 | 214 bu | 16,692 | $765 | $3.57 |
| River Bottom | Corn | 112 | 198 bu | 22,176 | $803 | $4.06 |
| Home Place | Soybeans | 96 | 66 bu | 6,336 | $547 | $8.29 |
| West 160 | Soybeans | 148 | 54 bu | 7,992 | $518 | $9.59 |
| South Wheat | Winter Wheat | 72 | 78 bu | 5,616 | $510 | $6.54 |
North 80: $420 inputs + $260 land + $85 overhead = $765 per acre; $765 ÷ 214 bu = $3.57 per bushel.
Tracking Contracts and Delivered Quantity
Each contract shows its value, remaining quantity and a status based on the report date: Filled once fully delivered, Past Due if the delivery month has passed with bushels or tons still owed, otherwise Open.
| Contract | Crop | Quantity | Delivered | Remaining | Value | Status |
|---|---|---|---|---|---|---|
| FC-2601Prairie Grain Coop | Corn | 25,000 | 25,000 | 0 | $109,500 | Filled |
| FC-2602Prairie Grain Coop | Corn | 20,000 | 6,500 | 13,500 | $90,400 | Open |
| FS-2605Midland Soy Processors | Soybeans | 4,000 | 0 | 4,000 | $44,200 | Open |
| SH-2608Cedar Valley Dairy | Alfalfa Hay | 120 | 95 | 25 | $27,000 | Past Due |
On the Crops tab, contracted quantity is valued at contract prices and the unpriced rest of production at your cash bid, which gives each crop's blended average price.
The Formulas Behind the Ledger
Total cost per acre (Fields): =[@[Input Cost per Acre]]+[@[Land Cost per Acre]]+Set_Overhead
Cost per bushel or ton: =IF([@Production]=0, 0, [@[Total Cost]]/[@Production])
Break-even yield per acre: =[@[Total Cost per Acre]]/([@[Crop Price]]-Haul and Dry per Unit)
Contract status: =IF([@[Remaining Quantity]]=0, "Filled", IF([@[Delivery Month]]<first day of report month, "Past Due", "Open"))
Net profit per field is revenue (production × the crop's average price) minus total cost minus hauling and drying. Compare bushel and ton crops by net per acre, since their production units differ. For a quick break-even check outside the workbook, try the free Break-Even Point Calculator.
Frequently Asked Questions
What sheets are in the Agriculture & Farm Crop Yield, Input Cost & Harvest Ledger?
7 linked sheets: Quick Start (setup steps and sheet map), Settings (Settings), Fields (Field Harvest Ledger: Cost per Acre, Yield & Net Profit), Contracts (Elevator Contracts & Sales Log), Crops (Crop Marketing & Profit by Crop), Dashboard (Farm Profit Dashboard) and Lists (editable dropdown values).
What does the Agriculture & Farm Crop Yield, Input Cost & Harvest Ledger calculate?
Field harvest ledger: seed, fertilizer, chemical, fuel and repairs and custom hire per acre plus land cost and a whole-farm overhead per acre give total cost per acre and per field. Yield per field in bushels or tons: production, actual vs expected yield, cost per unit and the break-even yield you need to cover cost. Elevator forward contracts and spot sales log with contract value, delivered and remaining quantity and an Open, Filled or Past Due status from the report date.
Does it use macros?
No. It is a plain .xlsx file. The calculations are visible worksheet formulas built with IFERROR, INDEX, MATCH and SUMIFS, so you can read and edit every one.
Which Excel versions does it work in?
Excel 2016 or later / Microsoft 365 / Excel for the web.
Can I try it before buying?
Yes. Download the free Lite edition and open it in Excel. The Pro edition is a one-time $9 payment with no subscription.
Customer Reviews
No reviews yet.
More Industry Specific Workbooks
Datasheetly spreadsheet workbooks and templates are operational productivity calculation tools provided for informational purposes only. They do not constitute certified public accounting (CPA), legal, tax, or medical advice. Templates are not certified or intended for the storage of protected health information (PHI) under HIPAA regulations or fiduciary client trust accounts without independent compliance review. Users are advised to review all financial and operational outputs with a licensed CPA, attorney, or qualified professional before taking formal financial or operational actions.